This site uses cookies to improve your experience. To help us insure we adhere to various privacy regulations, please select your country/region of residence. If you do not select a country, we will assume you are from the United States. Select your Cookie Settings or view our Privacy Policy and Terms of Use.
Cookie Settings
Cookies and similar technologies are used on this website for proper function of the website, for tracking performance analytics and for marketing purposes. We and some of our third-party providers may use cookie data for various purposes. Please review the cookie settings below and choose your preference.
Used for the proper function of the website
Used for monitoring website traffic and interactions
Cookie Settings
Cookies and similar technologies are used on this website for proper function of the website, for tracking performance analytics and for marketing purposes. We and some of our third-party providers may use cookie data for various purposes. Please review the cookie settings below and choose your preference.
Strictly Necessary: Used for the proper function of the website
Performance/Analytics: Used for monitoring website traffic and interactions
The shoppers who did venture to physical stores demonstrated their intent to purchase, as conversion, average transaction value (ATV) and shopper yield (sales per shopper) all posted strong increases. The low days of the month for sales, shopper traffic and ATV occurred at the start of Valentine’s Day week, before beginning to move upward.
While online shopping dominated Thanksgiving Thursday , stores carried their weight through the Black Friday weekend, reporting essentially flat sales year-over-year at a 0.9% decline in average transaction value (ATV), resulting in a strong increase in shopper yield (sales per shopper) of 5.4%. decrease on a 4.2%
Shopper traffic overall decreased 4 percent for the month, but conversion and average transaction (ATV) value both posted strong results, up 0.5 The high and low days of January were spread throughout the month, with the final day of the month – Saturday, February 1 – delivering the high days for sales, shopper traffic and ATV.
It was the third month in a row that physical stores recorded sales of at least 98.4 In August, conversion continued it long-term upward trend with an increase of 0.7 For a full reporting of physical store performance for the month of August 2019, please download your copy of the Retail Performance Pulse today.
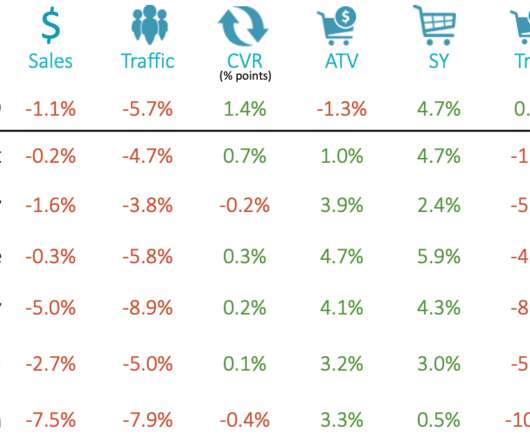
At an aggregated level, shopper traffic was 5.7 While conversion was at a high, average transaction value (ATV) dipped for the first time this year, posting a 1.3 While conversion was at a high, average transaction value (ATV) dipped for the first time this year, posting a 1.3 percent decline. percent decline.
We organize all of the trending information in your field so you don't have to. Join 40,000+ users and stay up to date on the latest articles your peers are reading.
You know about us, now we want to get to know you!
Let's personalize your content
Let's get even more personalized
We recognize your account from another site in our network, please click 'Send Email' below to continue with verifying your account and setting a password.


Let's personalize your content